Summer in the UK can be unpredictable. You never know when the blue skies will cloud over and the temperatures will drop overnight. Packing the right gear for all eventualities is essential.
Sprayway have been designing technical outdoor clothing in Manchester, UK for over 40 years. It all started in a humble garage in Chorlton, where they produced sailing gear before branching into waterproof jackets for mountaineers. Now Sprayway create kit for outdoor enthusiasts all over the world – from arctic explorers to National Park rangers. It’s no wonder they are masters when it comes to insulated jackets.
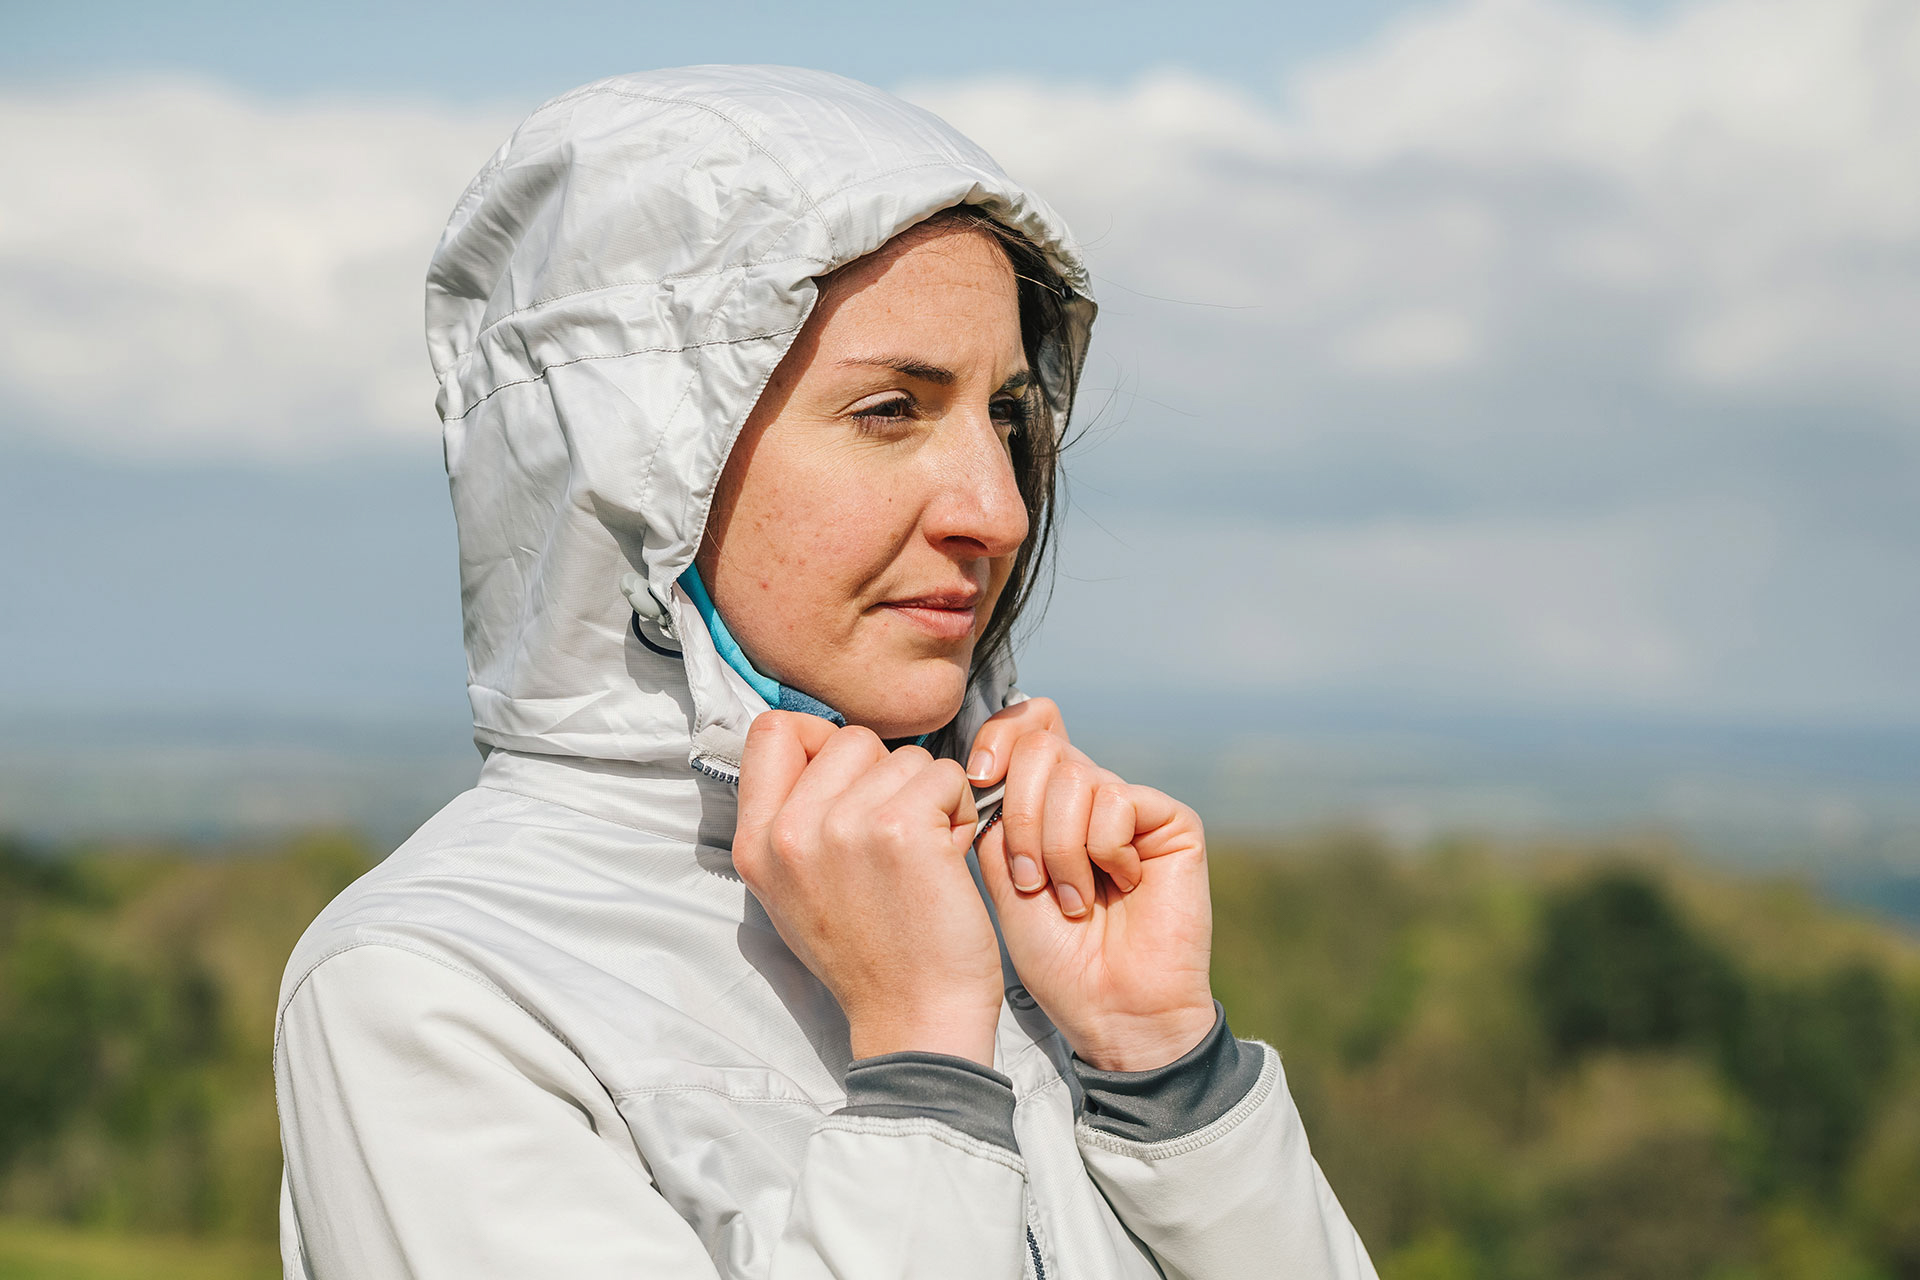
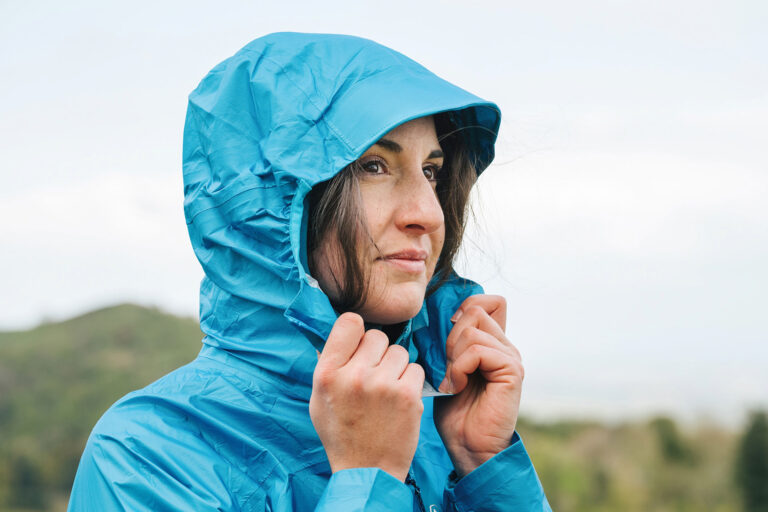
“You can wear it as an outer layer on dry blustery days or underneath a waterproof jacket for warmth.”
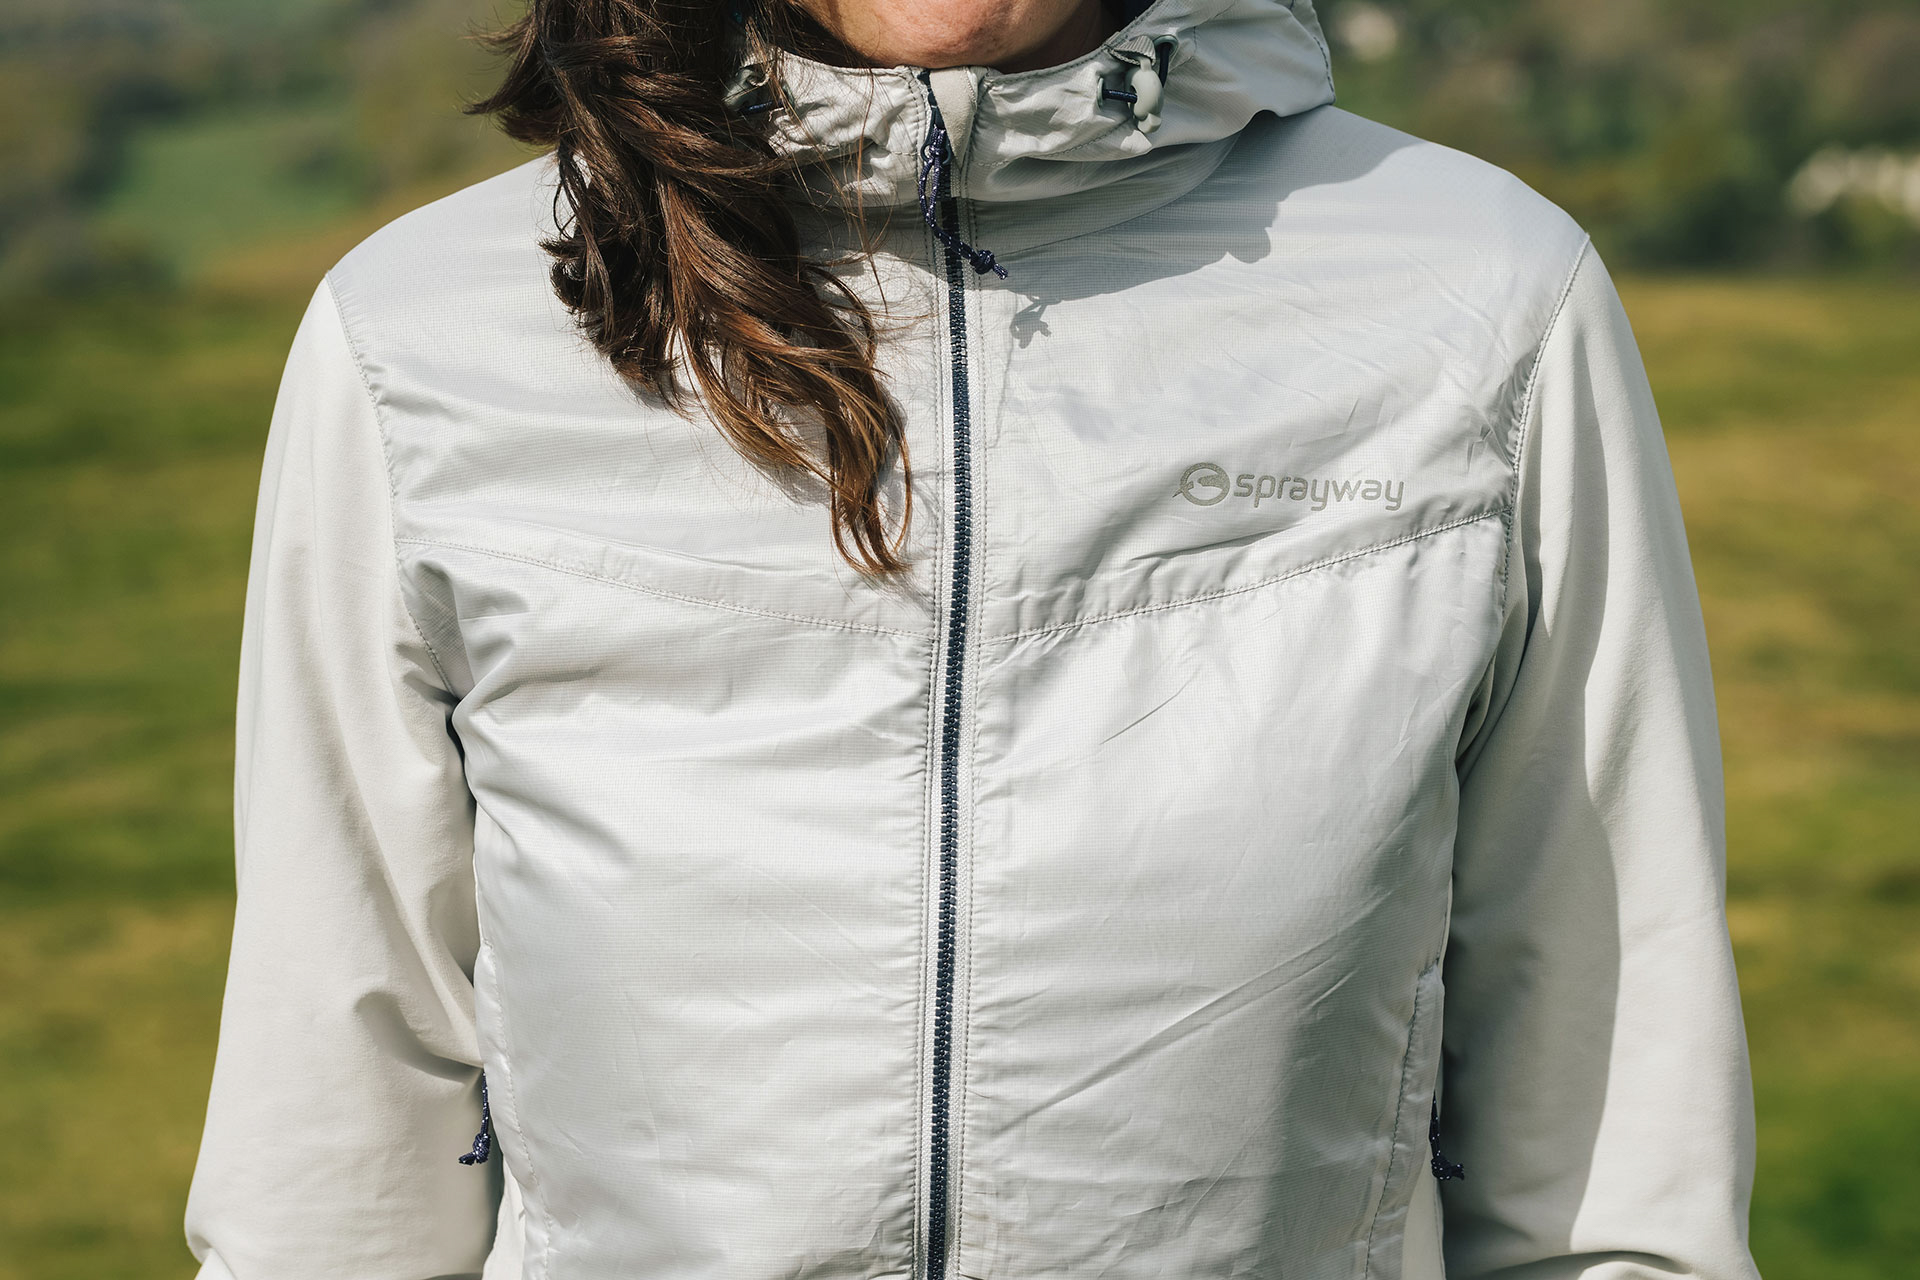
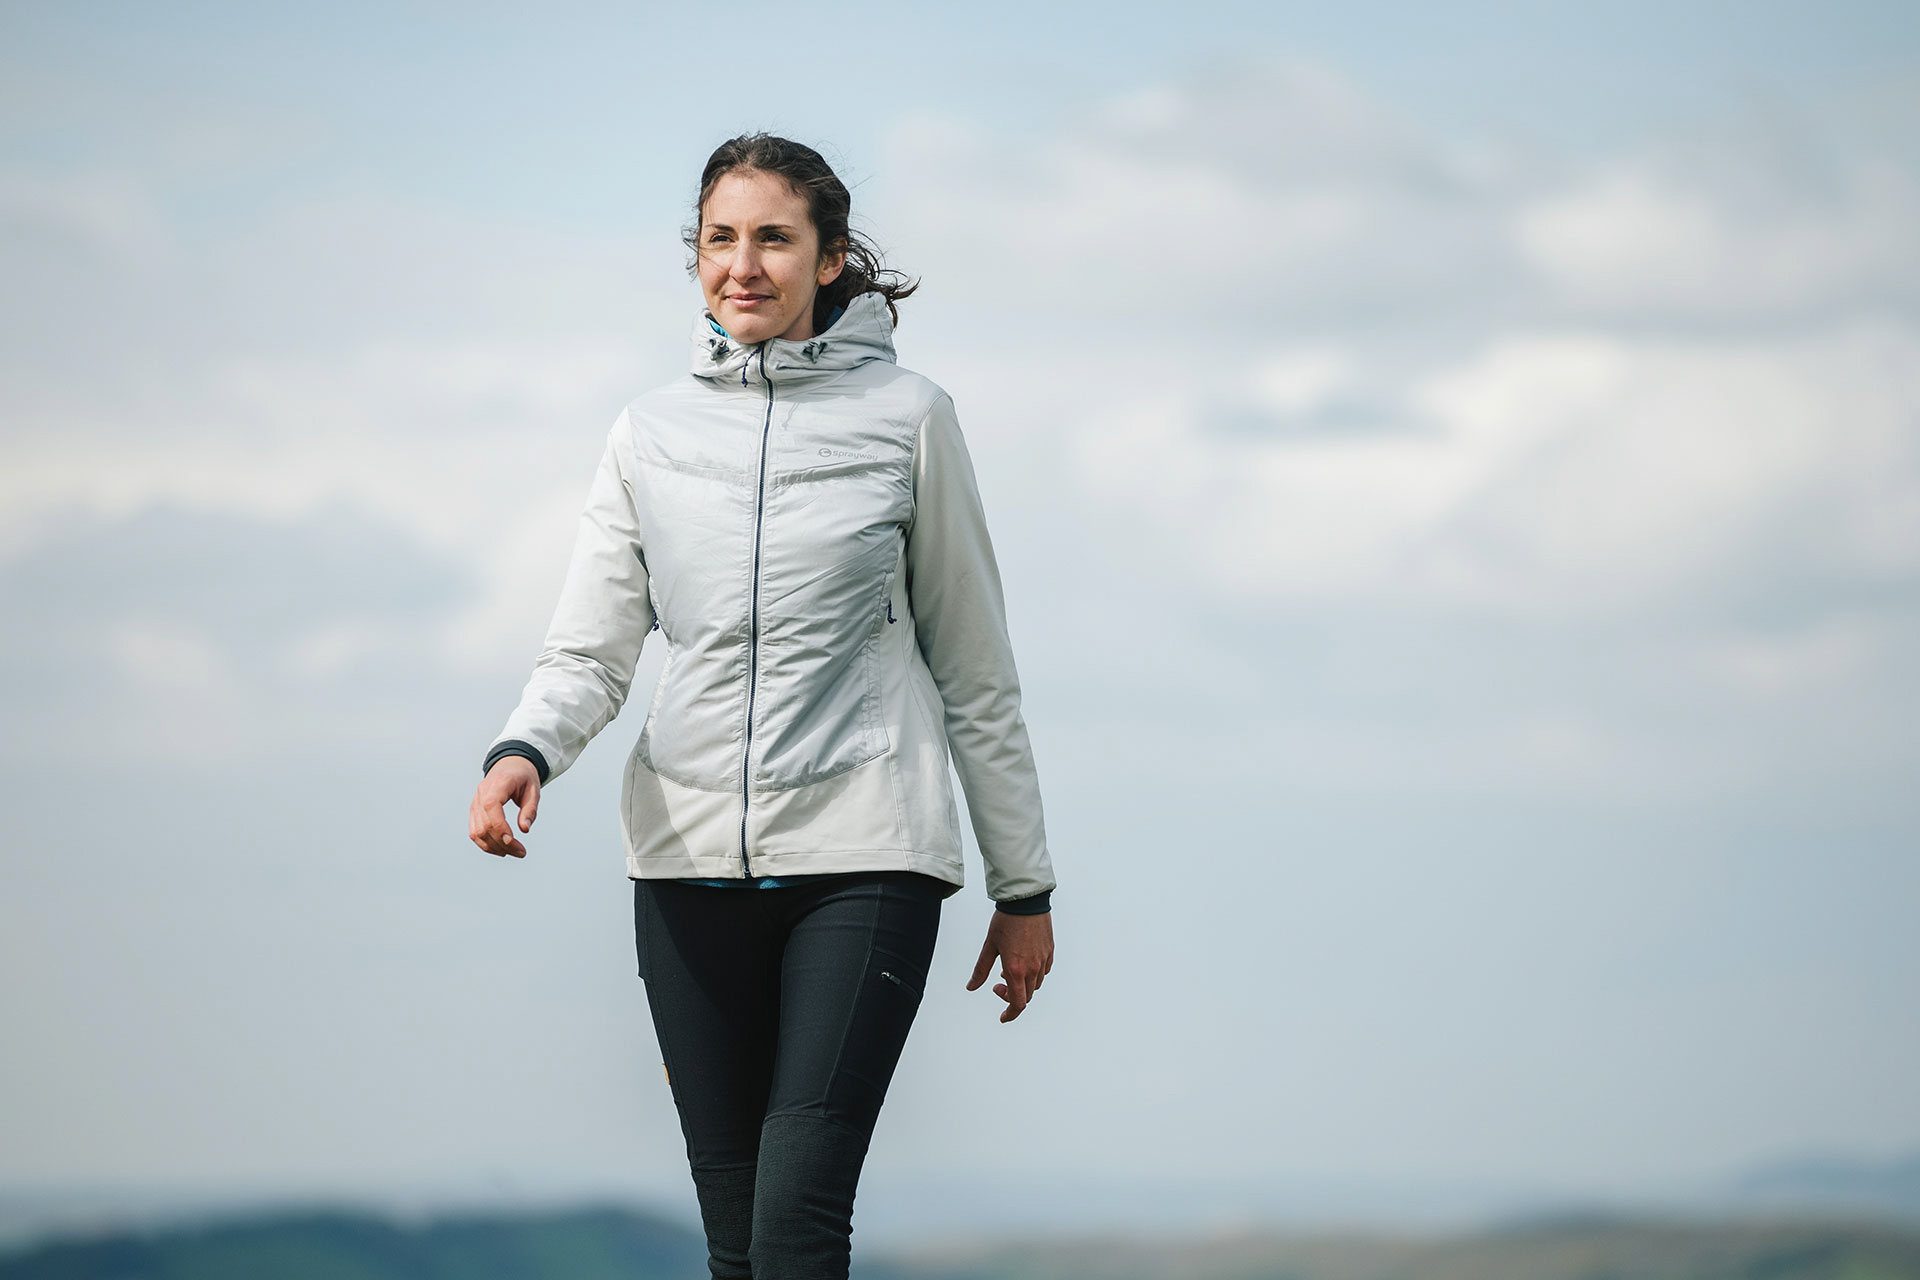
The Echo jacket is a prime example. It is a windproof, insulated jacket made specifically for women. Some companies compromise technical quality when it comes to women’s outdoor gear, but not Sprayway. They have a history of supporting British female climbers, including Lucy Creamer and Alison Hargreaves, who became the first woman to climb Everest unsupported and without the use of supplementary oxygen. So you can rest assured this softshell-style jacket is created using the highest-quality technical materials.
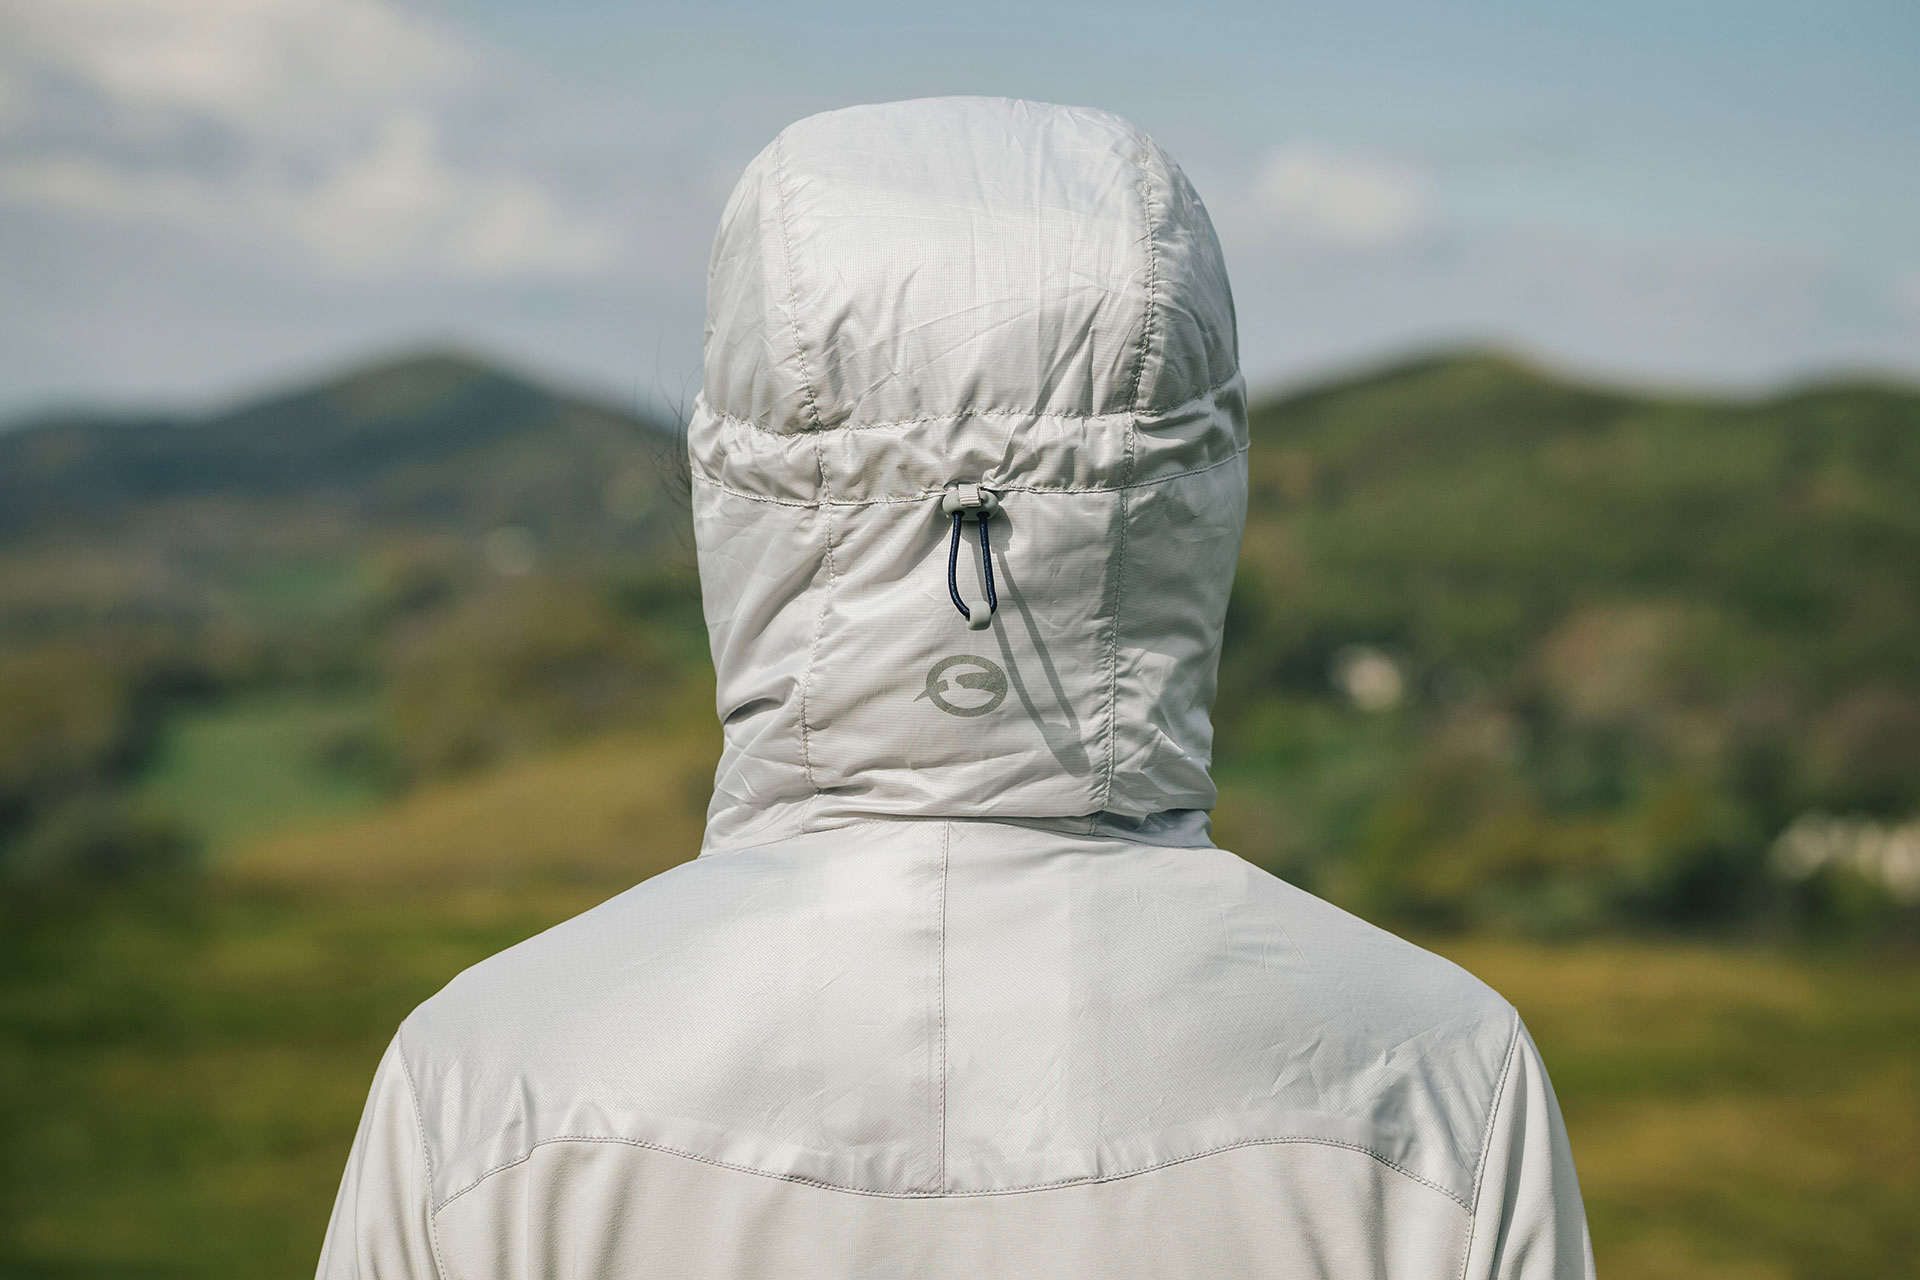
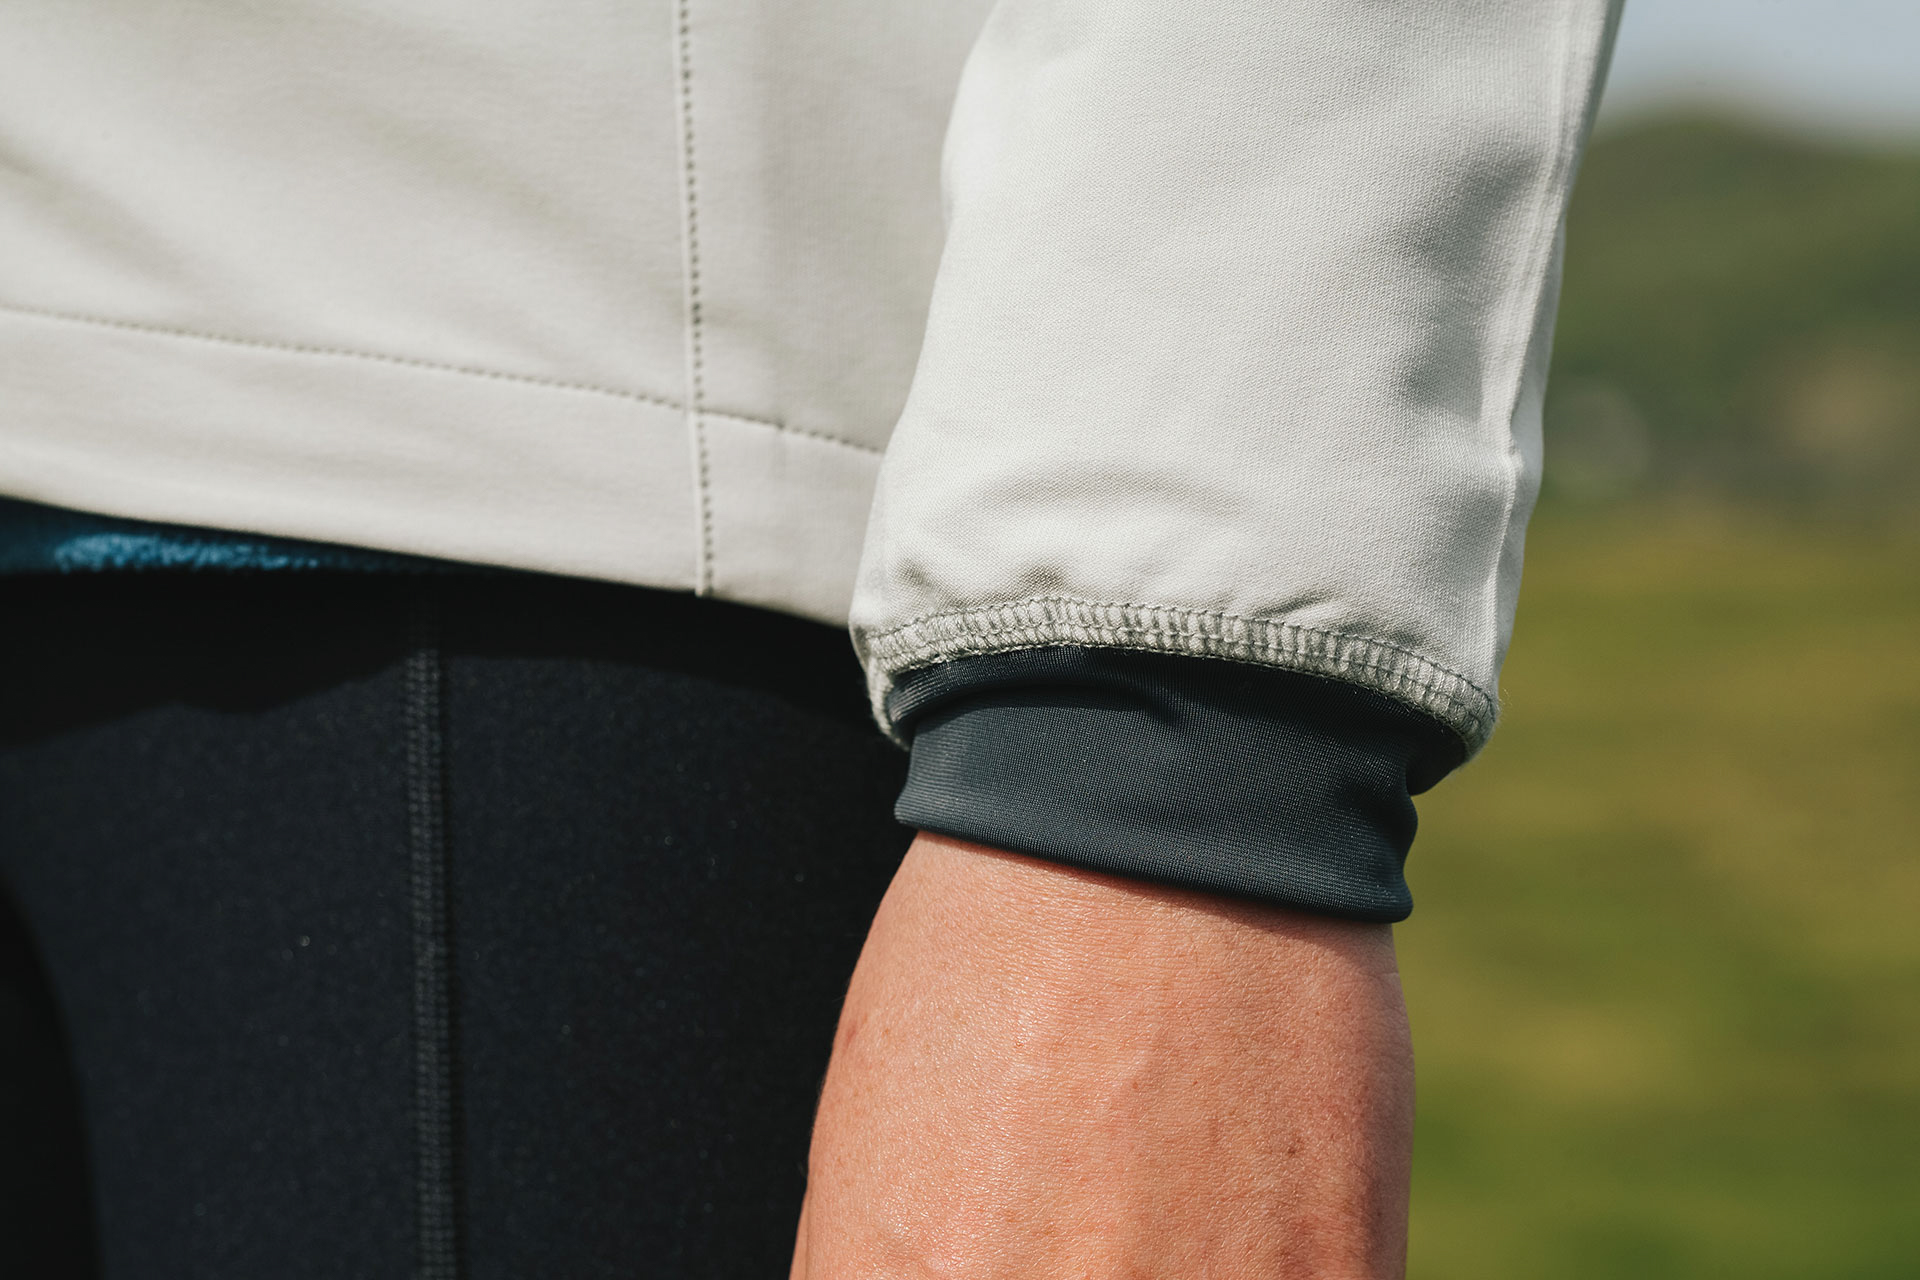
The Echo jacket is made using an innovative fabric called TecWeave. It’s stretchy, wind-resistant and durable, making it perfect for hiking or climbing in the mountains. You can move safe in the knowledge that the armpits aren’t going to tear while reaching for your next hold. It is super breathable and dries quickly when wet. The front and shoulders are enhanced with an extra windproof protection panel. So is the hood, which is wire-peaked and therefore great for windy days when you want it to stay in one place.